
Scientific Methodology [modified from the Khan Academy]
Learning Objectives
- Outline the general scientific method and give an example.
- Identify and describe the roles of basic elements of experimental design: dependent and independent variables, experimental treatments, positive and negative controls, sample size, and independent replicates.
- Be able to recognize the elements of experimental design in an example and to create your own experimental design that includes all the relevant elements.
Introduction
A biology investigation usually starts with an observation—that is, something that catches the biologist’s attention. For instance, a cancer biologist might notice that a certain kind of cancer can’t be treated with chemotherapy and wonder why this is the case. A marine ecologist, seeing that the coral reefs of her field sites are bleaching—turning white—might set out to understand why.
How do biologists follow up on these observations? How can you follow up on your own observations of the natural world? In this article, we’ll walk through the scientific method, a logical problem-solving approach used by biologists and many other scientists.
The scientific method
At the core of biology and other sciences lies a problem-solving approach called the scientific method. The scientific method has five basic steps, plus one feedback step:
- Make an observation.
- Ask a question.
- Form a hypothesis, or testable explanation.
- Make a prediction based on the hypothesis.
- Test the prediction.
- Iterate: use the results to make new hypotheses or predictions.
The scientific method is used in all sciences—including chemistry, physics, geology, and psychology. The scientists in these fields ask different questions and perform different tests. However, they use the same core approach to find answers that are logical and supported by evidence.
Scientific method example: Failure to toast
Let’s build some intuition for the scientific method by applying its steps to a practical problem from everyday life.
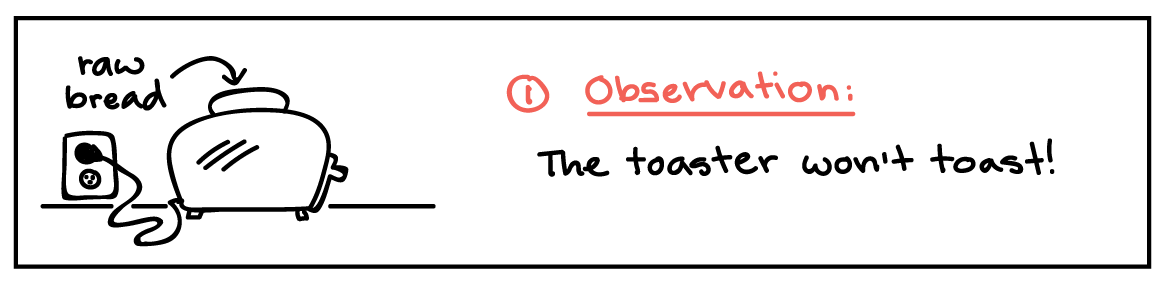
1. Make an observation.
Let’s suppose that you get two slices of bread, put them into the toaster, and press the button. However, your bread does not toast.
2. Ask a question.
Why didn’t my bread get toasted?
3. Propose a hypothesis.
A hypothesis is a potential answer to the question, one that can somehow be tested and falsified. For example, our hypothesis in this case could be that the toast didn’t toast because the electrical outlet is broken.
This hypothesis is not necessarily the right explanation. Instead, it’s a possible explanation that we can test to see if it is likely correct, or if we need to make a new hypothesis.
4. Make predictions.
A prediction is an outcome we’d expect to see if the hypothesis is correct. In this case, we might predict that if the electrical outlet is broken, then plugging the toaster into a different outlet should fix the problem. Predictions are frequently in the form of an If-then statement.
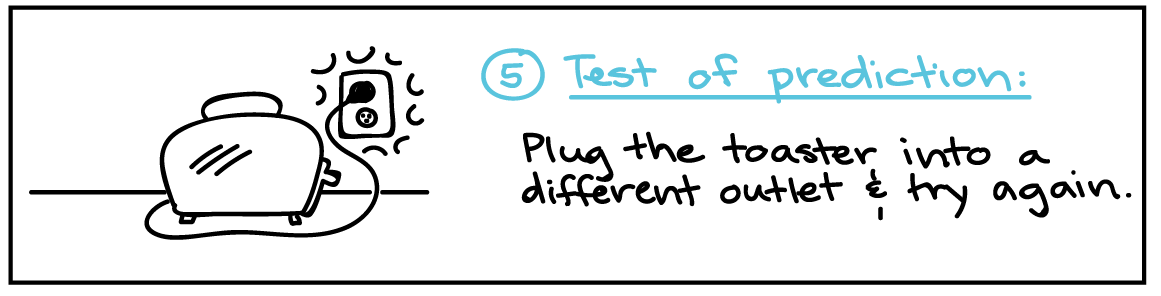
5. Test the predictions.
To test the hypothesis, we need to make an observation or perform an experiment associated with the prediction. In this case, we would plug the toaster into a different outlet and see if it toasts.
-
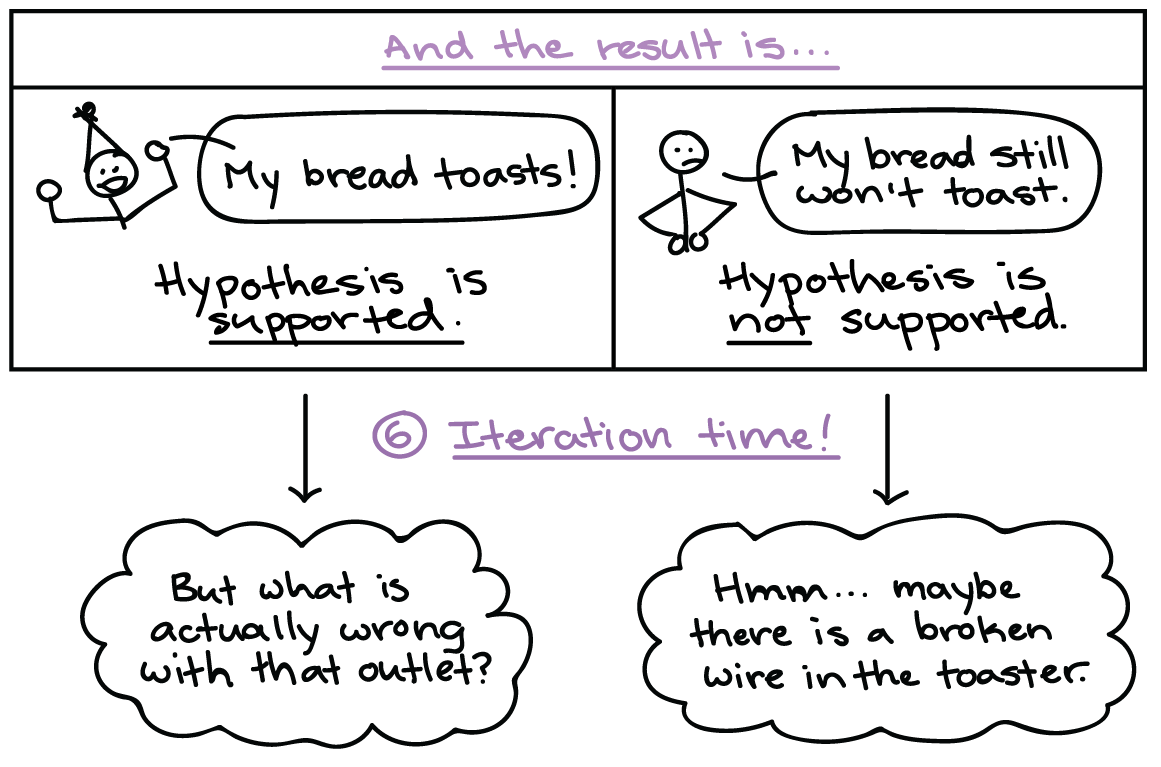
If the toaster does toast, then the hypothesis is supported, which means it is likely correct.
-
If the toaster doesn’t toast, then the hypothesis is not supported, which means it is likely wrong.
The results of a test may either support or refute a hypothesis. Results that support a hypothesis can’t conclusively prove that it’s correct, but they do mean it’s likely to be correct. On the other hand, if results refute a hypothesis, that hypothesis is probably not correct. Unless there was a flaw in the test—a possibility we should always consider—a contradictory result means that we can discard the hypothesis and look for a new one.
6. Iterate.
The last step of the scientific method is to reflect on our results and use them to guide our next steps.
-
If the hypothesis was supported, we might do additional tests to confirm it, or revise it to be more specific. For instance, we might investigate why the outlet is broken.
-
If the hypothesis was not supported, we would come up with a new hypothesis. For instance, the next hypothesis might be that there’s a broken wire in the toaster.
In most cases, the scientific method is an iterative process. In other words, it’s a cycle rather than a straight line. The result of one go-round becomes feedback that improves the next round of question asking.
How is the scientific method used by biologists?
Quick recap: Biologists and other scientists use the scientific method to ask questions about the natural world. The scientific method begins with an observation, which leads the scientist to ask a question. She or he then comes up with a hypothesis, a testable explanation that addresses the question.
A hypothesis isn’t necessarily right. Instead, it’s a “best guess,” and the scientist must test it to see if it’s actually correct. Scientists test hypotheses by making predictions: if hypothesis X is right, then Y should be true. Then, they do experiments or make observations to see if the predictions are correct. If they are, the hypothesis is supported. If they aren’t, it may be time for a new hypothesis.
Hypotheses are tested using controlled experiments
What are the key ingredients of a controlled experiment? To illustrate, let’s consider a simple (even silly) example.
Suppose I decide to grow bean sprouts in my kitchen, near the window. I put bean seeds in a pot with soil, set them on the windowsill, and wait for them to sprout. However, after several weeks, I have no sprouts. Why not? Well…it turns out I forgot to water the seeds. So, I hypothesize that they didn’t sprout due to lack of water.
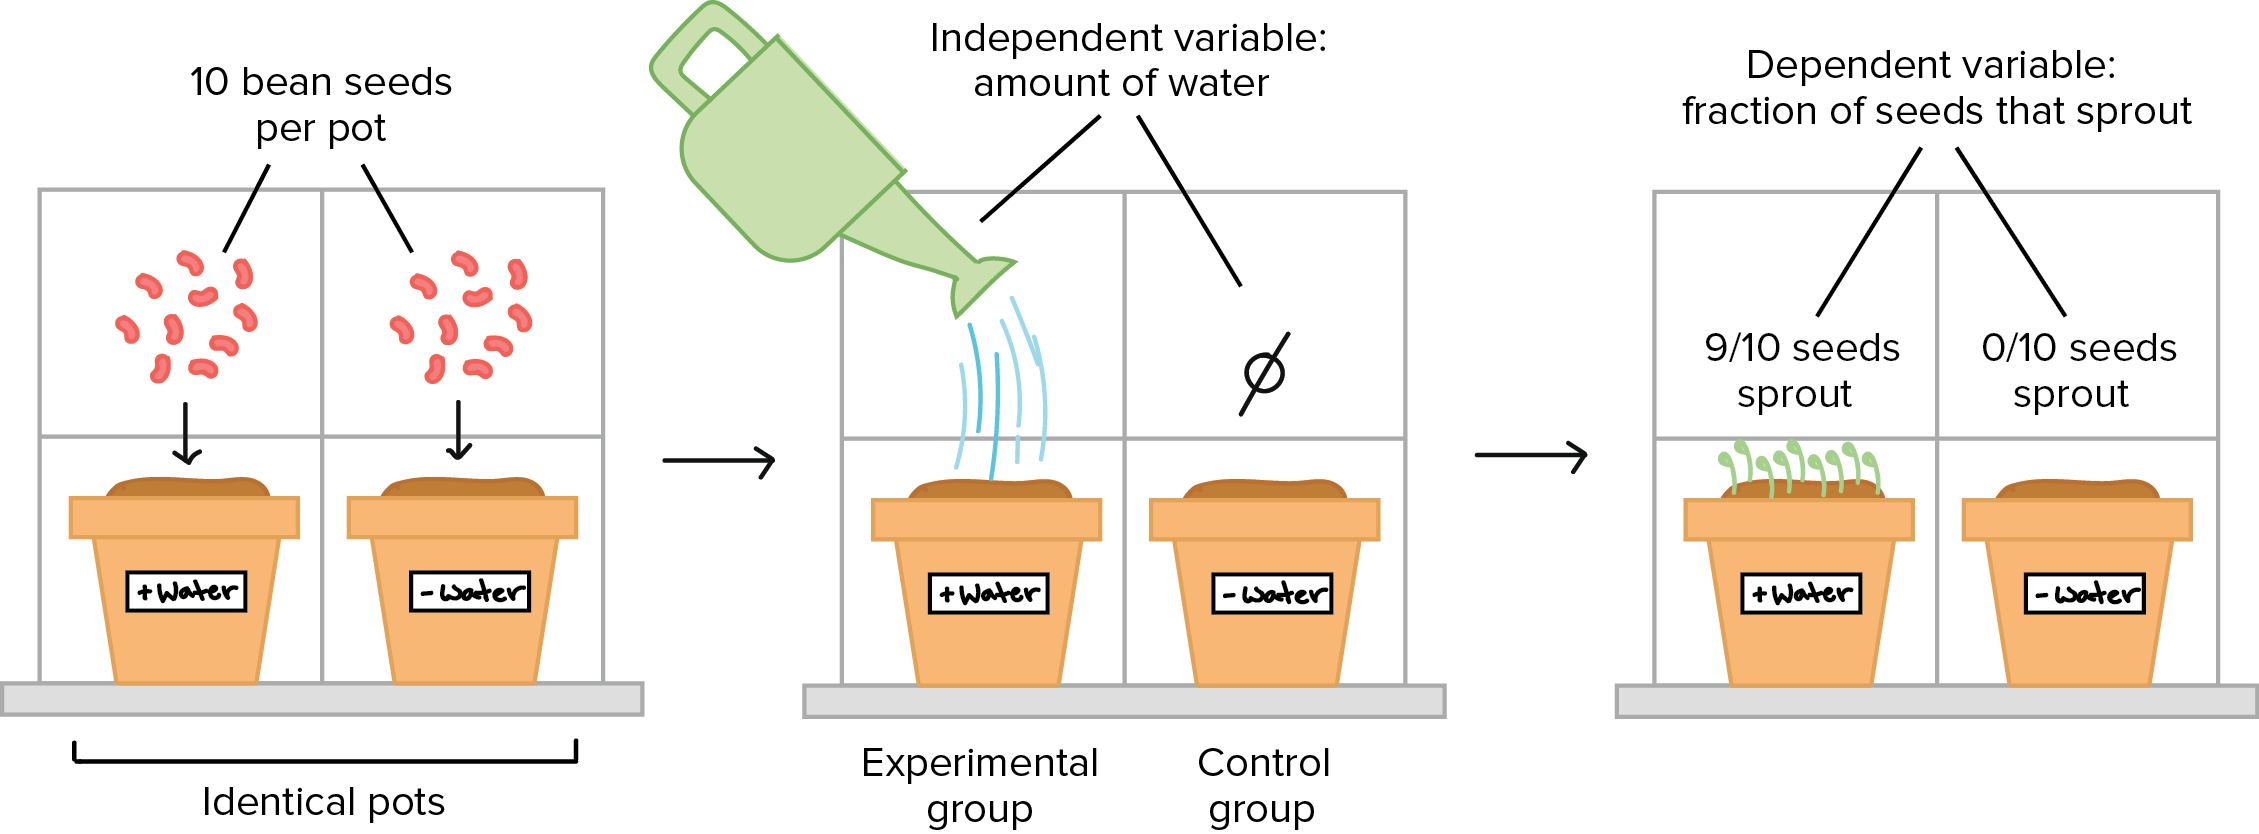
To test my hypothesis, I do a controlled experiment. In this experiment, I set up two identical pots. Both contain ten bean seeds planted in the same type of soil, and both are placed in the same window. In fact, there is only one thing that I do differently to the two pots:
- One pot of seeds gets watered every afternoon.
- The other pot of seeds doesn’t get any water at all.
After a week, nine out of ten seeds in the watered pot have sprouted, while none of the seeds in the dry pot have sprouted. It looks like the “seeds need water” hypothesis is probably correct!
Let’s see how this simple example illustrates the parts of a controlled experiment.
Control and experimental groups
There are two groups in the experiment, and they are identical except that one receives a treatment (water) while the other does not. The group that receives the treatment in an experiment (here, the watered pot) is called the experimental group, while the group that does not receive the treatment (here, the dry pot) is called the control group. The control group provides a baseline that lets us see if the treatment has an effect. Controls can be positive controls to demonstrate that the process or treatment actually works, or they can be negative controls, where no change should occur during the experiment.
Independent and dependent variables
The factor that is different between the control and experimental groups (in this case, the amount of water) is known as the independent variable. This variable is independent because it does not depend on what happens in the experiment. Instead, it is something that the experimenter applies or chooses him/herself. Experiments can have more than one independent variable.
In contrast, the dependent variable in an experiment is the response that’s measured to see if the treatment had an effect. In this case, the fraction of bean seeds that sprouted is the dependent variable. The dependent variable (fraction of seeds sprouting) depends on the independent variable (the amount of water), and not vice versa.
Experimental data (singular: datum) are observations made during the experiment. In this case, the data we collected were the number of bean sprouts in each pot after a week.
Variability and repetition
Out of the ten watered bean seeds, only nine came up. What happened to the tenth seed? That seed may have been dead, unhealthy, or just slow to sprout. Especially in biology (which studies complex, living things), there is often variation in the material used for an experiment – here, the bean seeds – that the experimenter cannot see.
Because of this potential for variation, biology experiments need to have a large sample size and, ideally, be repeated several times. Sample size refers to the number of individual items tested in an experiment – in this case, bean seeds per group. Having more samples and repeating the experiment more times makes it less likely that we will reach a wrong conclusion because of random variation.
In fact, the beans in pots experimental design here has a major flaw. All the beans for each treatment are planted in the same pot. What if there’s an effect of the pot itself, its soil, or its location, that causes the beans in one to germinate better. A better design would be to plant each seed in its own pot, so that each seed is completely independent of the next seed. The independence of each sample is required to correctly use the statistical tests that biologists and other scientists use to help them distinguish real differences from differences caused by random variation (e.g., when comparing experimental and control groups).
Consider this example: A farmer wants to maximize her tomato crop yield and wonders if re-potting her plants in soil with various concentrations of nitrogen:phosphorus ratios will affect growth of tomato plants. After consulting the literature, she hypothesized that fertilizers high in nitrogen will produce fewer tomatoes, and fertilizers high in phosphorus will produce many tomatoes. Use this information to:
- Identify independent and dependent variables
- Provide suggestions for independent variable
- Suggest possible positive and negative controls
- Sketch a graph for this experiment
- What are some other variables that could affect the tomato crop? Suggest a follow-up experiment with a research question, hypothesis, independent, dependent, and control variables.