
Learning Objectives
- Explain the concepts and data used in constructing phylogenetic trees and identify that DNA is the universal information storage for all living organisms.
- Explain species relatedness on the tree of life, where deeper branches represent longer times to common ancestry, and use the branching pattern to predict the relationships between two species.
- Define and identify common ancestor for any two species on a tree, including the Last Universal Common Ancestor (LUCA) on the tree of life.
- Recognize that similarity in the data is used to predict relatedness and construct phylogenetic trees.
What is a phylogenetic tree?
A phylogenetic tree is a visual representation of the evolutionary or family relationship between different organisms, showing the path through evolutionary time from a common ancestor to different descendants.
Figure 1 below shows a tree of three living species, A, B, and C. Each species is a tip on the tree, and usually these represent living species in the present day.
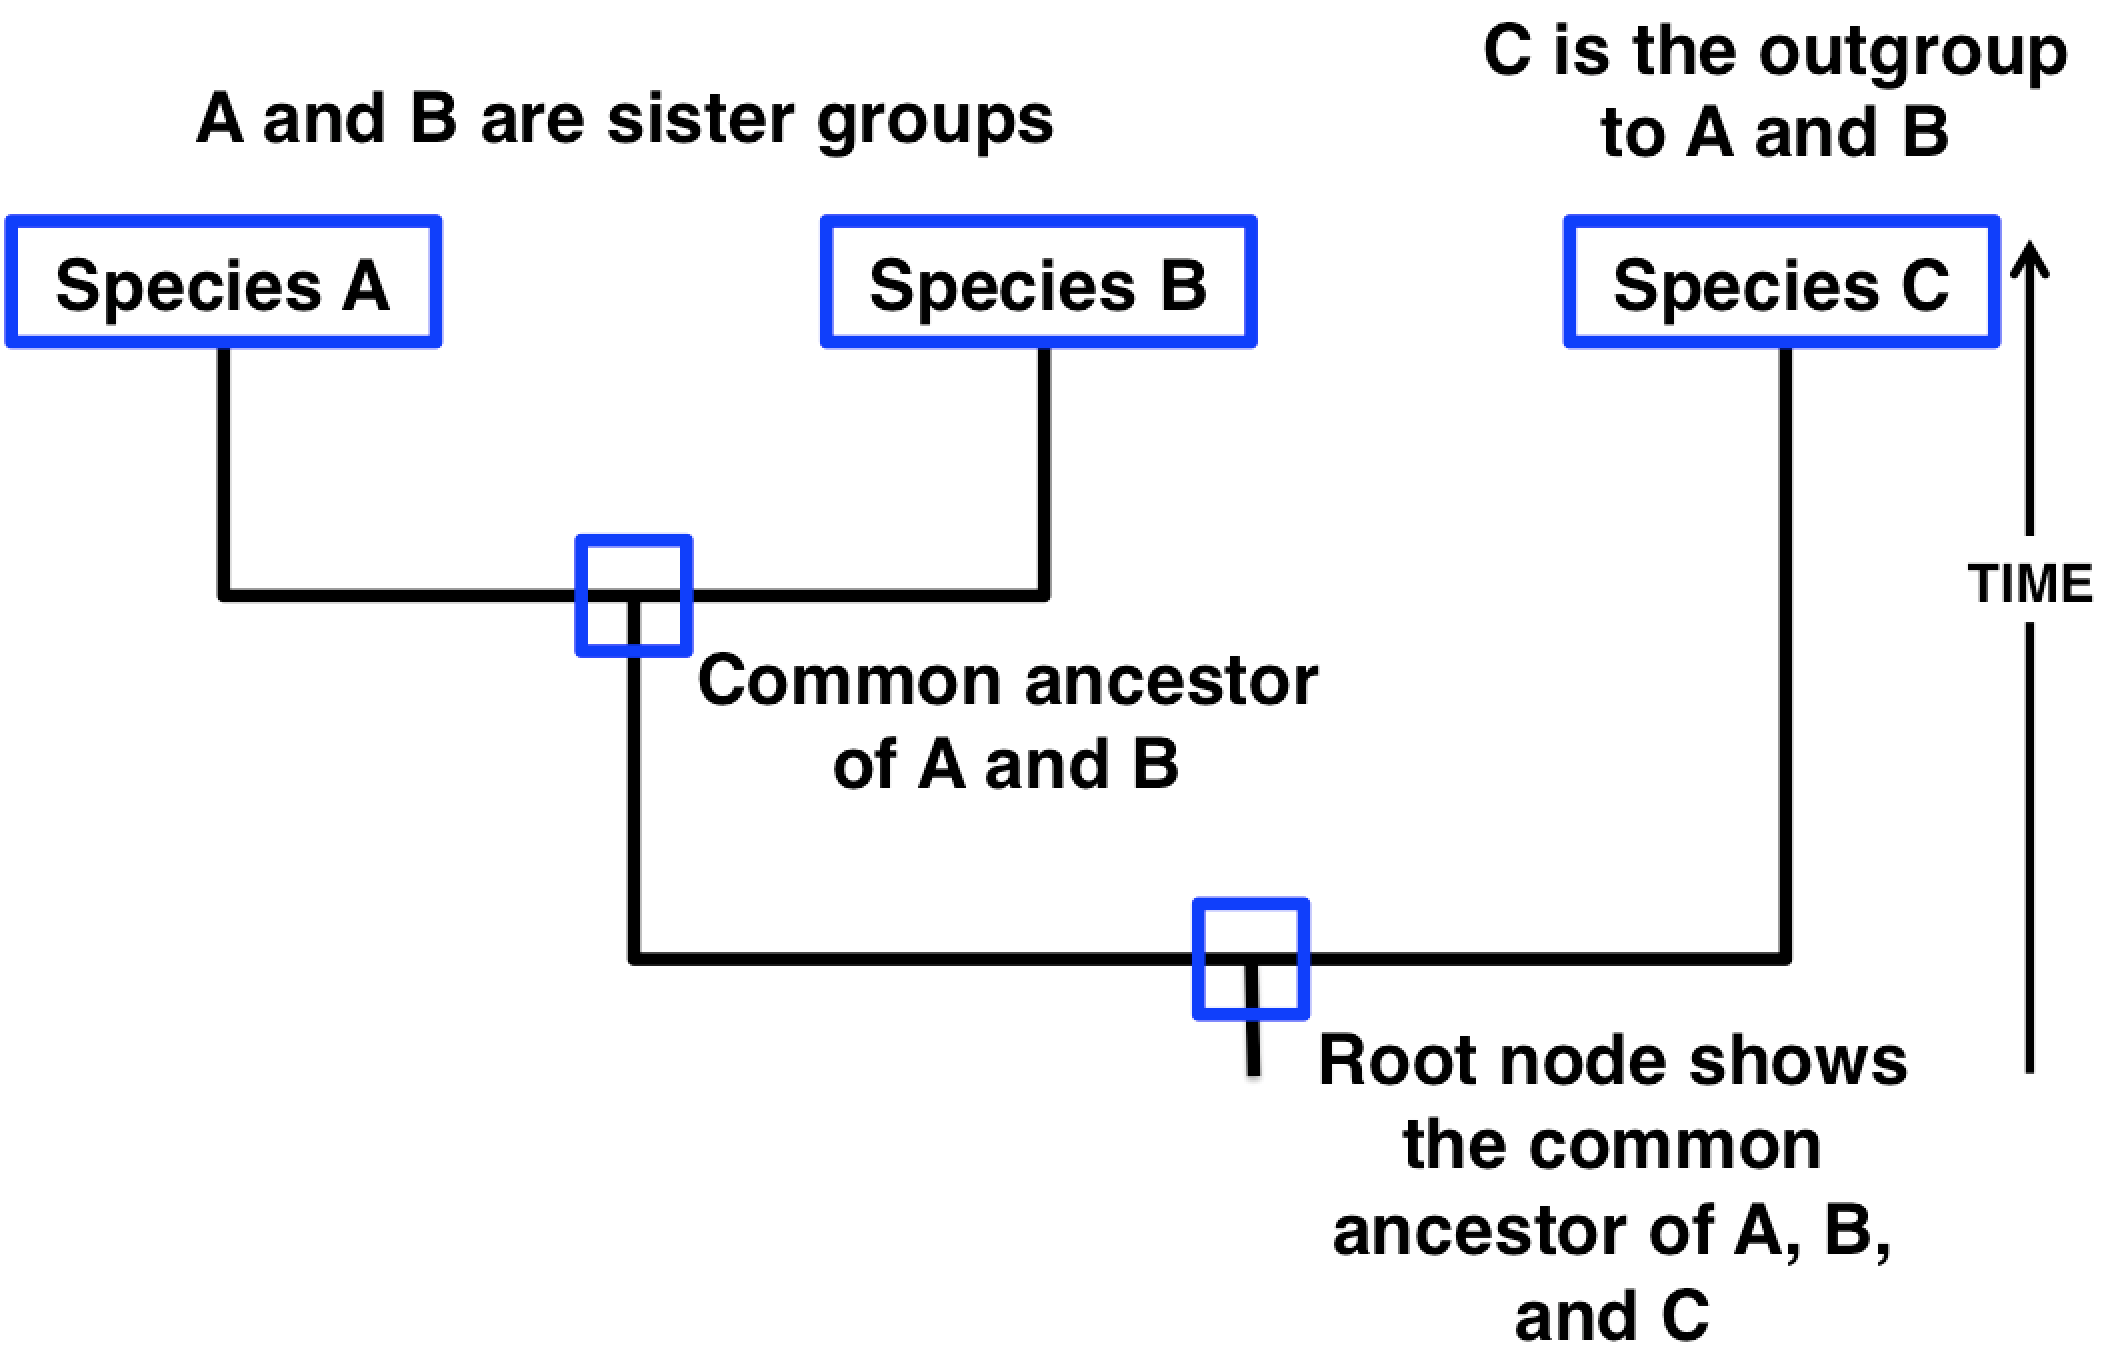
Figure 1. Modified from http://evolution.berkeley.edu/evolibrary/article/phylogenetics_02.
Terminology of phylogenetic trees
Biological lineages lead from the tips (present) into the past ancestry of the species. Each lineage is represented by a vertical line, called a branch, and the lineages diverge or bifurcate at nodes. A node signifies a speciation event from a common ancestor, who existed at the node, into two new species or types. The trees shown on this page are “bifurcating” trees, because they always branch from one to two.
The trunk at the base of the tree, or root, ends in a root node that represents the most recent common ancestor of all of the taxa on the tree. Time proceeds vertically from the oldest at the root to the most recent at the tips. What the tree above tells us is that taxon A and taxon B are more closely related to each other than either is to taxon C. The reason is that taxa A and B share a more recent common ancestor with each other than either of them does with taxon C. A and B cluster together to form a clade, a group of taxa that includes a common ancestor and all of its descendants. Clades that meet this definition are said to be monophyletic.
The image below shows two monophyletic trees (top row) contrasted with non-monophyletic trees (bottom row).

The coloured boxes represent clades (top row) or non-clades (bottom row). Image from http://evolution.berkeley.edu/evolibrary/article/side_0_0/evo_06
The video below focuses on terminology and explores some misconceptions about reading trees:
Misconceptions and how to correctly read a phylogenetic tree
Trees can be confusing to read. A common mistake is to read the tips of the trees and think their order has meaning. In the tree in Figure 1 above, the closest relative to species C is not species B. Both A and B are equally distant from, or related to, species C. In fact, switching the labels of species A and B would result in a topologically equivalent tree. It is the order of branching along the time axis that matters. The illustration below shows that rotating the branches around the nodes, much like a hanging mobile, does not affect the structure of the tree:

http://evolution.berkeley.edu/evolibrary/article/%3C?%20echo%20$baseURL;%20?%3E_0_0/evotrees_primer_08

Hanging bird mobile by Charlie Harper
It can also be difficult to recognize how the trees model evolutionary relationships. One thing to remember is that any tree represents a minuscule subset of species from the full tree of life.
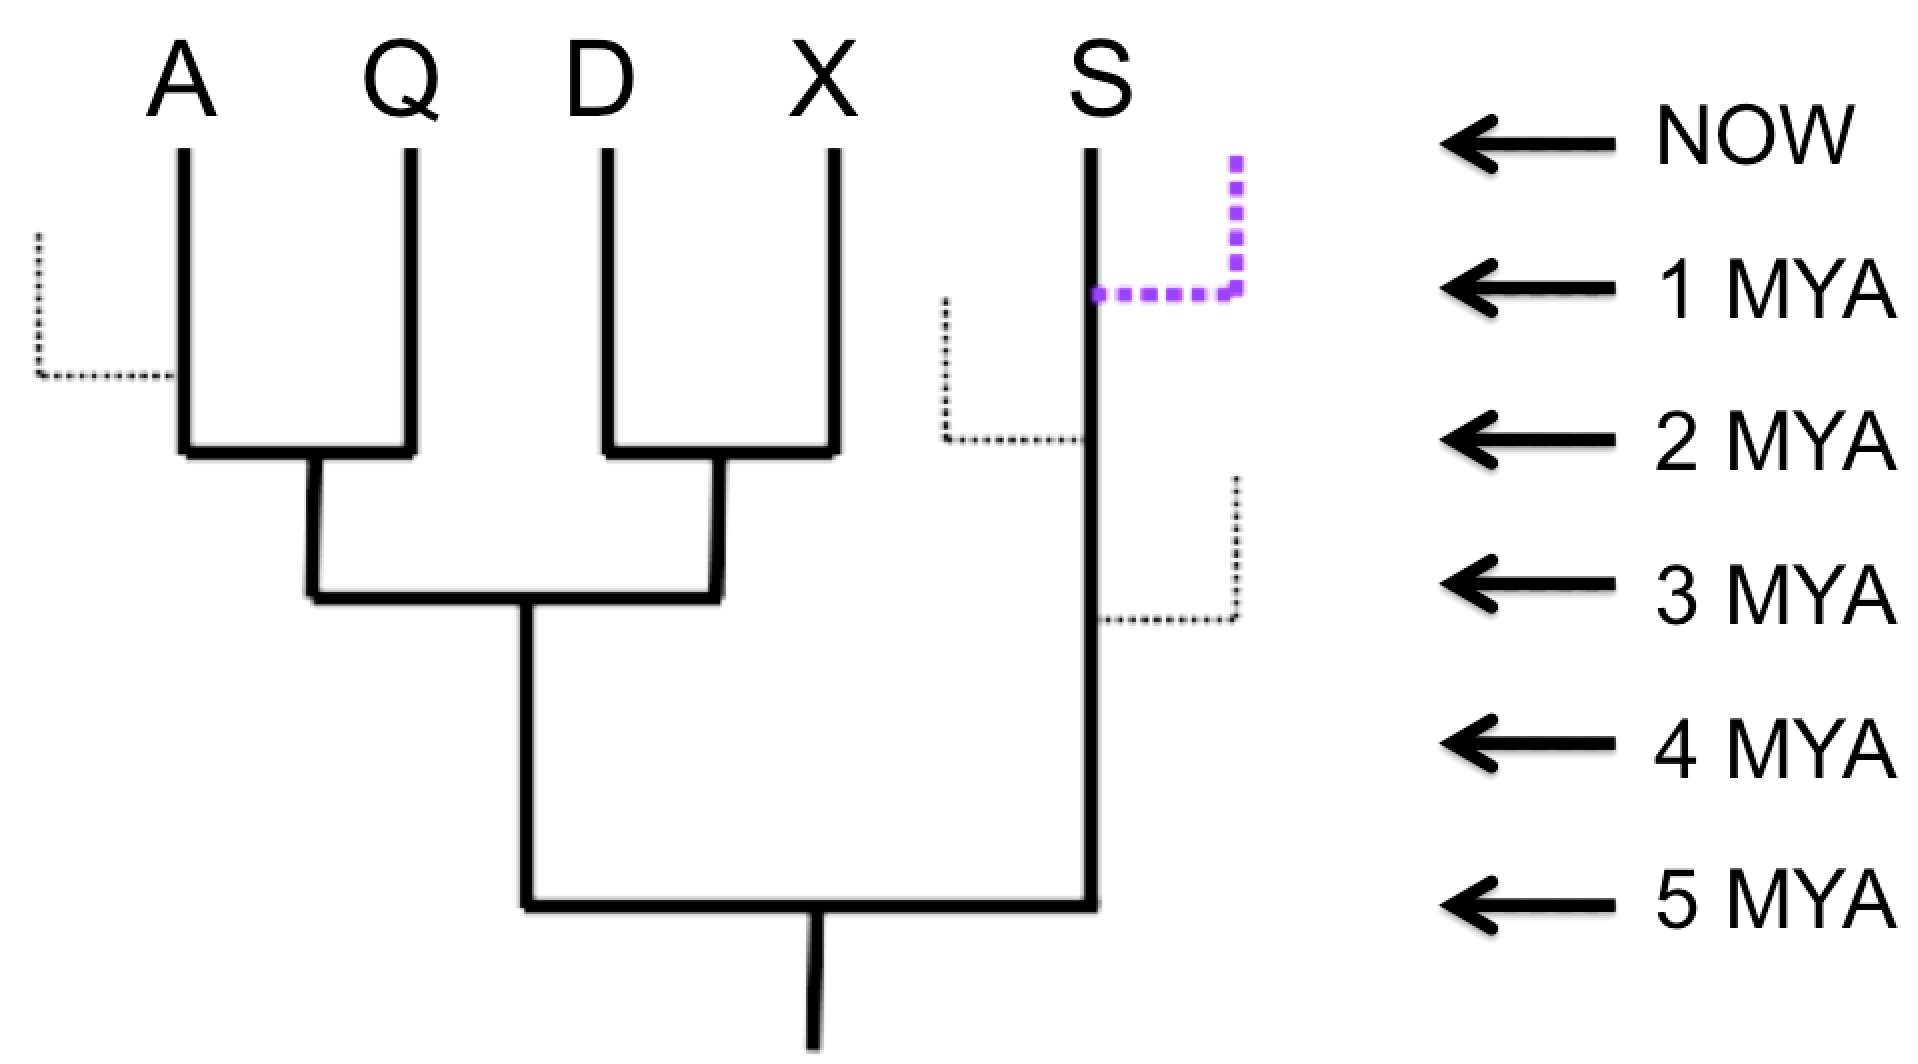
A tree of 5 species (A, Q, D, X, S) with evolutionary time shown in millions of years ago (Mya). The purple dotted line represents an evolutionary lineage of a currently living species not represented in the 5-species tree. The fine dotted lines indicate a few evolutionary lineages that have gone extinct; note that they do not extend vertically to the present day. Image credit: Diagram is original work of Jung Choi.
Given just the 5-species tree (ignoring the dotted branches), it is tempting to think that taxon S is the most “primitive,” or most like the common ancestor represented by the root node, because there are no additional nodes between S and the root. However, there were undoubtedly many branches off that lineage during the course of evolution, most leading to extinct species (99% of all species are thought to have gone extinct), and many to living species (like the purple dotted line) that are just not shown in the tree. What matters, then, is the total distance along the time axis (vertical axis, in this tree). The time axis indicates that species S evolved for 5 million years, the same length of time as any of the other 4 species. As the tree is drawn, with the time axis vertical, the horizontal axis has no meaning, and serves only to separate the species and their lineages for the viewer’s benefit. So, none of the currently living species are any more “primitive” nor any more “advanced” than any of the others; they have all evolved for the same length of time from their most recent common ancestor.
The time axis also allows us to measure evolutionary distances quantitatively. The distance between A and Q is 4 million years (A evolved for 2 million years since they split, and Q also evolved independently of A for 2 million years after the split). The distance between A and D is 6 million years, and they split from their common ancestor 3 million years ago.
Phylogenetic trees can have different forms—they may be oriented sideways, inverted (most recent at bottom), or the branches may be curved, or the tree may be radial (oldest at the center). Regardless of how the tree is drawn, the branching patterns all convey the same information: evolutionary ancestry and patterns of divergence.
This video does a great job of explaining how to interpret species relatedness using trees, including describing some of the common incorrect ways to read trees:
Constructing phylogenetic trees
Many different types of data can be used to construct phylogenetic trees. We’ll consider two types: morphological and genetic data. Morphological data includes structural features, types of organs, and specific skeletal arrangements, while genetic data incorporates genomic and mitochondrial DNA sequences, ribosomal RNA genes, and often focuses on genes of interest.
These types of data are used to identify homology, which means similarity due to common ancestry. This is simply the idea that you inherit traits from your parents, only applied on a species level: all humans have large brains and opposable thumbs because our ancestors did; all mammals produce milk from mammary glands because their ancestors did. These traits are homologous.
Trees are constructed on the principle of parsimony, meaning that the most likely branching pattern is the one requiring the fewest changes. For example, it is much more likely that all mammals produce milk because they all inherited mammary glands from a common ancestor that produced milk from mammary glands, versus the less parsimonious hypothesis that multiple groups of organisms each independently evolved mammary glands.
Optional resources
An excellent site on phylogenetic trees: http://evolution.berkeley.edu/evolibrary/article/0_0_0/evotrees_intro