
Learning Objectives
- Recognize the characteristics of an infectious disease that spreads either through contact between individuals or through a disease vector, like the mosquito.
- Diagram a basic SIR model, including transmission rate and a recovery rate, and use it to predict disease spread outcomes.
- Define the net reproduction rate, R0. Interpret R0 values and graphs of disease models to predict the outcome of an infectious disease. Appreciate that R0 is a relatively uncertain value early in an epidemic.
- Define “herd immunity” or community immunity and explain why herd immunity is not a valid short term goal for the SARS-CoV-2 virus, which causes Covid-19.
What is an infectious disease and how does it spread?
Humans play host to tons of disease-causing agents: viruses, bacteria, fungi, and other pathogens. The World Health Organization defines infectious disease as disease caused by pathogenic microorganisms that “can be spread, directly or indirectly, from one person to another.” The disease agents are simply using the host as a habitat for their own survival and reproduction, causing infection in the host. Infectious diseases include ringworm, the flu, HIV, Zika, and coronavirus, among many others.
Diseases spread through host-to-host contact or through vector-to-host contact. Imagine you have the flu, and you sneeze, making a cloud full of small droplets of liquid, each of which contains the flu virus. If those droplets make their way to the mucus membranes, like the nose or mouth, of another potential host, the disease can spread to them. Some diseases require exchange of bodily fluids (HIV, STIs), while others need direct contact with an individual or object that carries the disease agent (scabies, lice), and others can spread in droplets in the air (flu, cold, SARS coronavirus).
Agencies like the CDC devote many research dollars and personnel to predicting infectious disease spread. They oversee three National Centers for:
- Emerging and Zoonotic Infectious Diseases (NCEZID) – Zika, etc.
- HIV/AIDS, Viral Hepatitis, STD, and TB Prevention (NCHHSTP) – blood-born and sexually transmitted diseases
- Immunization and Respiratory Diseases (NCIRD) – influenza, SARS, etc.
At those agencies biologists who specialize in mathematical modeling use data and math to try to predict how a disease will spread. These predictions help public health agencies determine if they have an epidemic situation of disease spread, how many people will become sick, how fast the disease will spread, and what actions a local community might take to prevent that spread.
How do we model disease?
Modeling disease is actually pretty easy math, at least at its basic level. Imagine you have a population of 100 individuals, and 1 of them gets an infection. With some basic assumptions about how those individuals interact with each other, we can predict the disease spread. Here are the things we need to assume:
- The total number of individuals does not change (i.e., its still 100 at the end of the disease spread)
- Everyone who gets infected is immediately able to infect others.
- All susceptible individuals have the same risk of exposure to the disease.
- The disease is spread directly between individuals (so, no mosquito vector for this simple example).
- Transmission of the disease depends on the density of the individuals, where density means how frequently the individuals encounter each other.
So, we have two groups of people in the population: infecteds and susceptibles. When an infected bumps into a susceptible, the infected can transmit the disease to the susceptible. Disease transmission is the product of two things:
- how many susceptible individuals contact infected individuals, and
- the probability that a contact leads to a new infection.
Sometimes you just get lucky when you interact with a sick person, but other times you catch their bug. The transmission rate includes:
- the number that are infectious
- the contact rate between an infectious and susceptible type
- the proportion that are susceptible
- the chance that contact leads to new infection
We’ll sketch out this model schematically in class.
The problem with the disease scenario above is that you can’t get better once you are infected. Instead, the disease will progress until everyone is infected. This is not unrealistic, as many STIs are like this. For instance, practically everyone who is sexually active has HPV, at least until the vaccine was introduced in 2006. Humans versus Zombies is another example of disease spread where everyone ends up infected, and becomes a zombie. What if you could recover, or if you could die, from the disease? We could add one more assumption to allow individuals to recover (or be removed from the population):
6. Recovery occurs at a constant recovery rate that is the inverse of the average time individuals are infectious. Recovered individuals are resistant to disease!
Removal from the infected group occurs when an infected individuals recovers from the disease. After the disease has run its course, those who recovered have developed immunity and cannot be reinfected (at least, that is what the simplest model assumes, and it is true for a lot of diseases in the short term). Recovery is always a matter of time, although sometimes we can help recovery along with medication for the disease or for its symptoms. Now we have these model elements:
- Initial numbers of Susceptible, Infected, and Removed individuals in a population. These vary over time but always sum to the total population size.
- Transmission and Recovery rates. These are fixed for a disease outbreak. They remain constant for the entire run of the disease.
These five elements are all we need to consider how to control a flu epidemic, or the spread of the common cold.
In class, we will diagram a basic Susceptible and Infected (SI) model and use it to predict and explain the outcome of the game Humans versus Zombies. Then, we’ll add in Removed individuals to craft a full “SIR” model for influenza or covid-19.
How can the model predict if disease will spread?
In a real epidemic situation, we can estimate the population size of susceptible individuals and track the disease cases. These collected data can be used to estimate the transmission rate and the recovery rate, and the estimates are only as good as the data. Rate estimates then allow us to predict the key value for disease spread, the basic reproduction number, R0(pronounced: R-nought) . The basic reproduction number (R0) indicates the average number of new cases each infected individual will make in a susceptible population. Watch the video below to learn about R0 and how it can tell us whether a disease will spread and cause an epidemic (when R0 > 1) or not (when R0 <= 1).
[The text below is modified from Khan Academy]
Once research has established a reasonable value of R₀ for an epidemic, R₀ can help predict how many people are likely to get infected from a single contagious patient (assuming no physical distancing, vaccination, or other interventions to reduce disease spread). The R₀ value allows scientists to rank how contagious a disease is:
- R₀ = 0 means that nobody will catch the infection
- R₀ = 1 means that 1 new person will catch the infection from each infectious individual. This defines the upper limit of an “endemic” or non-spreading disease.
- R₀ = 5 means that 5 new people will catch the infection from each infectious individual, and so on…
In some diseases, a single patient can spread the disease for days (e.g. Ebola) and in others, for decades (e.g. HIV). It turns out that Ebola has an R₀ of 2, which means that while a single patient is infectious, they will transmit the virus to an average of 2 other people (unless we intervene). Compare this with one of the most contagious viruses around, Measles, which can travel in the air and spread to an average of 18 people!
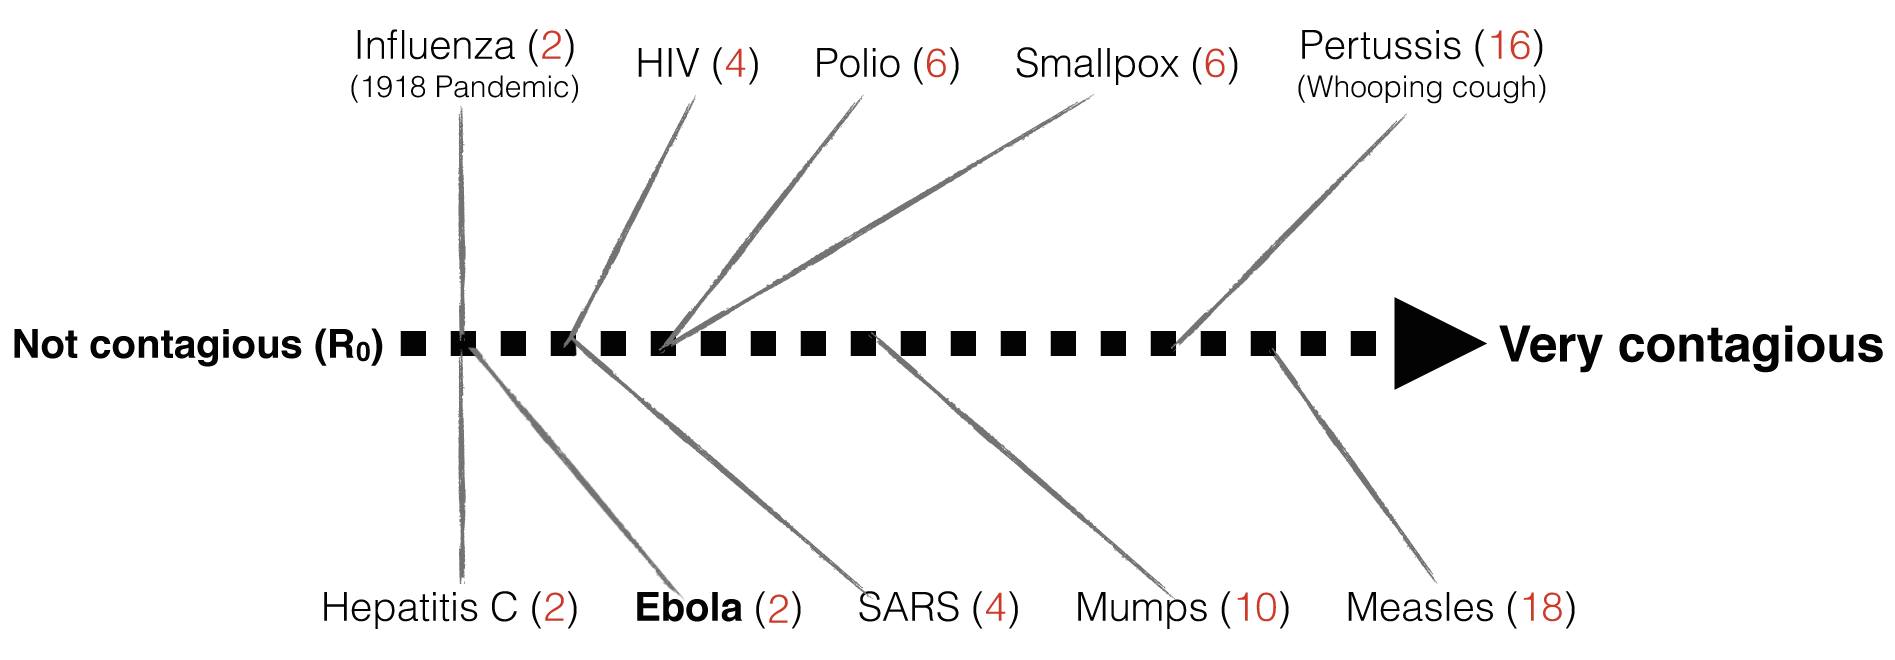
R-nought for various diseases including Ebola [Image credit: Khan academy. Sources: Center for Disease Control & World Health Organization, n.d.; Meltzer et al., 2014; Mills, Robins, & Lipsitch, 2014]
In class, we’ll consider what we know about where SARS-CoV-2 falls on this R₀ continuum and consider how to use these ideas to think about the spread of disease, and ways to control that spread.
Herd Immunity
Disease models help us to predict:
- if a disease will spread, and at what rate of spread,
- the total number infected at any one time,
- how changes to the transmission rate will slow or increase the rate of spread.
These all have practical implications: we can compare predicted hospitalization numbers with available health care capacity. We can put transmission-slowing measures in place through public health interventions like wearing masks, self isolating if exposed, limiting the number of people who may gather together, and stay-at-home restrictions. Perhaps one of the most helpful ideas that comes out of these models is called “herd immunity,” also known as community immunity.
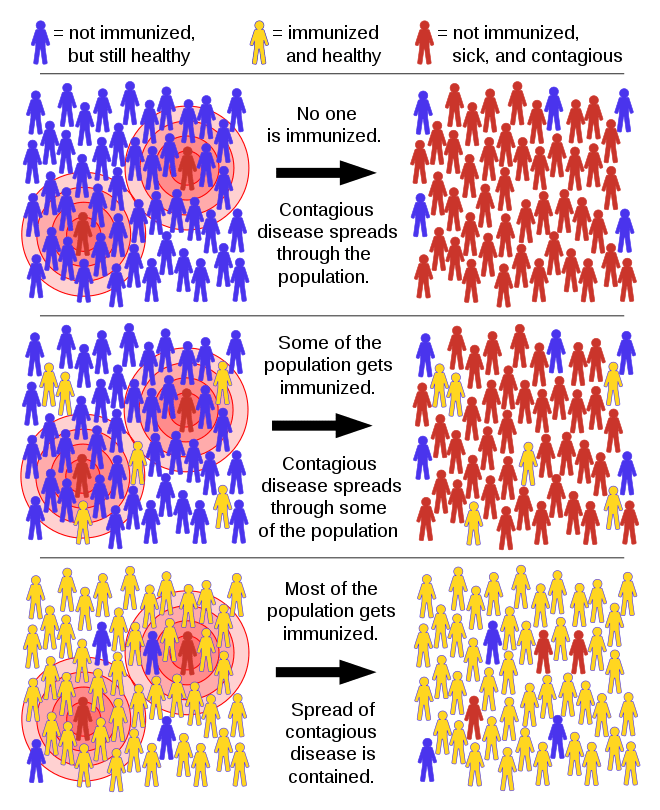
Herd immunity. Image credit: Tkarcher / CC BY-SA (https://creativecommons.org/licenses/by-sa/4.0)
In herd immunity, the model predicts that there is a critical proportion of susceptible individuals below which disease cannot spread. The idea is that any susceptible individuals are surrounded by so many immune individuals that they are not very likely to encounter an infectious individual. That sounds like good news…but it has a definite downside. Unless a lot of people have had the disease, and run the morbidity and mortality risks that come with that disease, then there are few naturally occurring ways for herd immunity to work. Herd immunity is how vaccines prevent disease spread, and we’ll think more about this idea when we discuss immunity and immunization. In the absence of a SARS-CoV-2 vaccine and with such high mortality rates, herd immunity is not a reasonable goal for the short term prevention of Covid-19 disease control.